A monthly report built from the official open data, measuring how many homes are completed and how well the official series agree with each other.
Completions are estimated from ESB connections. Commencements are recorded separately, in the Building Control system. Permissions are recorded separately again, and no common identifier links any of them.
The Irish Housing Pipeline triangulates these official sources, quantifies where they diverge, and publishes derived indicators of pipeline health at national and local-authority level.
Latest data: 2026 Q2 (CSO NDQ01 / NDQ06). Sources: CSO NDQ01 / Planning Permissions.
Headlines from the current report. The PDF has the charts, the county table and the method.
Source: CSO New Dwelling Completions (NDQ01, NDQ06), CSO planning permissions (BHQ12), ESB connections via CSO NDQ04. Derived figures by AK Planning & Development Ltd. Information only.
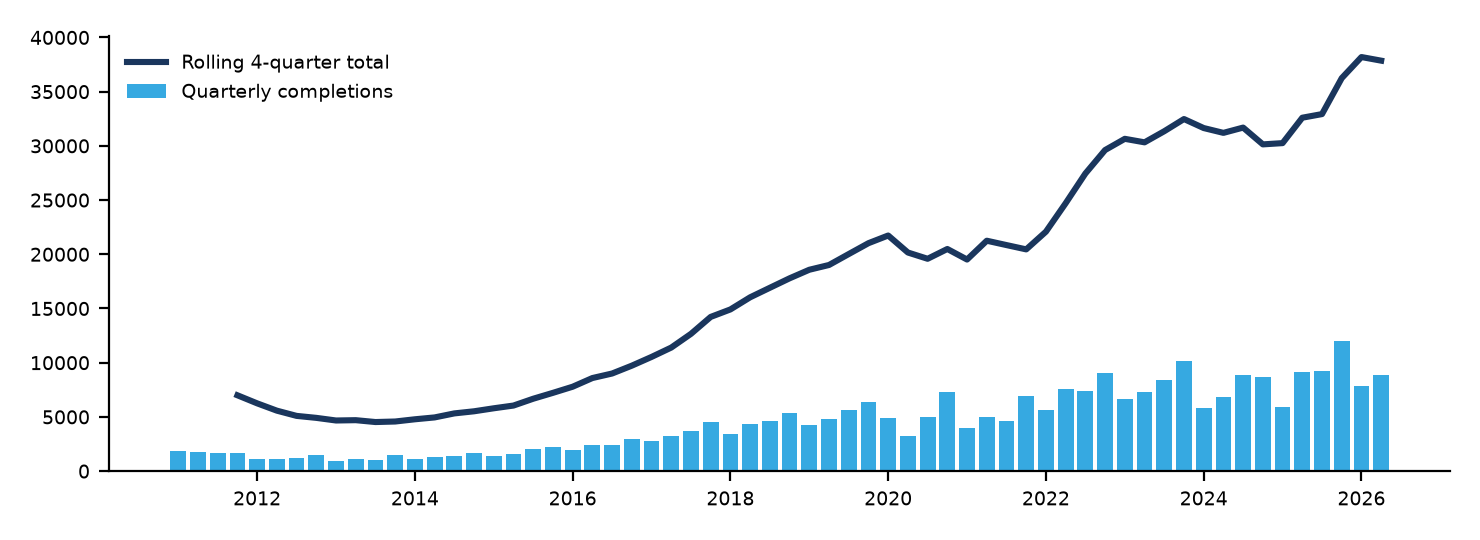
Quarterly new-dwelling completions with the rolling four-quarter total, the headline measure of delivery.
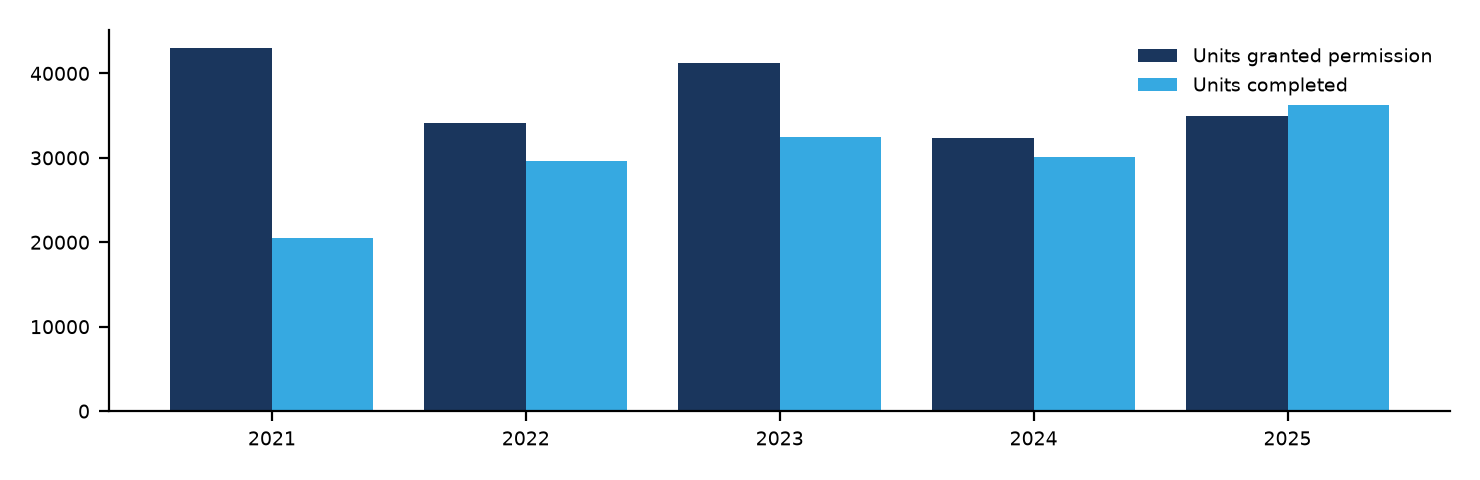
Units granted permission against units completed, the surplus that hints at how much extant pipeline is building up.
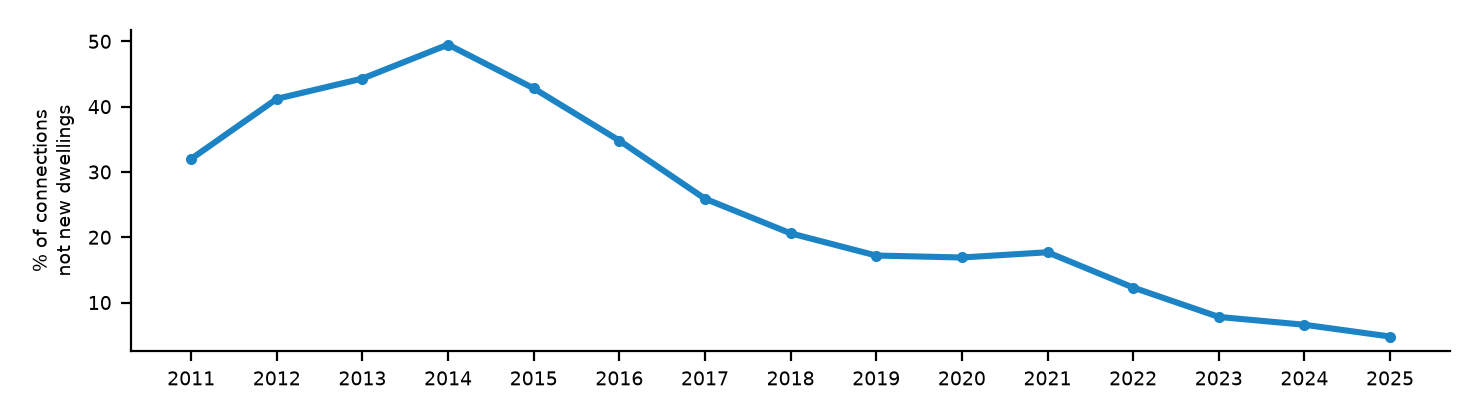
The share of new ESB domestic connections that are not new dwellings, the structural wedge between raw connection counts and true delivery.
Free and open to everyone, no sign-up. Completions by dwelling type for all 31 local authorities; pick a county below.
Also here: historical quarterly series, new-build price premium by county, and a downloadable data archive, all free.
The national picture, the measurement gap, permissions versus the uncommenced pipeline, a full county league table and market indicators, in one branded monthly PDF.
Follow along each month:
The Irish Housing Pipeline is published free and open by AK Planning, no paywall, no sign-up. If it's useful in your work, the best support is to cite it, share it, or get in touch.
Monthly figures and commentary, as they're published.
Every planning application in Ireland since 2013, across all 31 authorities, cross-referenced with the BCMS for commencement notices. The leading indicator behind the completions data.
Search the register →The exempted development limits after the July 2026 regulations, interactively: extensions, garden homes, dormers, sheds and more.
Open the checker →Every 2026 planning circular, statutory instrument and commencement order in one list, with a line on what each does and a link to the source.
Open the tracker →Where this report differs from figures published elsewhere, the difference is a property of the underlying sources, and quantifying it is the whole point.
Sources. CSO PxStat (completions NDQ01/NDQ06, ESB connections NDQ04, planning permissions); DHLGH/BCMS commencement notices via data.gov.ie; PSRA Property Price Register; RTB; BPFI. All raw files are archived unaltered on download, with retrieval dates, and every ingestion run is logged.
Derived indicators. Rolling four-quarter completions; the ESB overcount share; the commencement–completion gap; a v1 estimate of the extant/uncommenced pipeline (assumptions stated in full); county rankings and regional shares; new-build premium; estate sell-through detection.
Licensing. CSO data is published under CC BY 4.0 (attribution retained in every report). Derived metrics and the report itself are © AK Planning & Development Ltd.